tl;dr
We created a new type of Twitter trend chart and brought the legendary Hot 100 to life in new ways.
- Content Strategy
- Product Strategy
- User Experience
- Visual Design
You already know Billboard; the charts, the awards show, the interviews. Having been around for over 100 years, Billboard IS music. That’s exactly why we were so psyched when we were asked to design new chart experiences for the iconic brand.
Music in 140 Characters or Less
Hit the right chord with a person, and you will find the music they’re rabid about. Combine that with the fervor of social media and you have a powder keg of opinions on artists, albums, and tracks. Billboard naturally saw this at work and wanted to reflect the conversation on their site. So they partnered up with the tiny blue bird and now had a huge amount of data to work with.
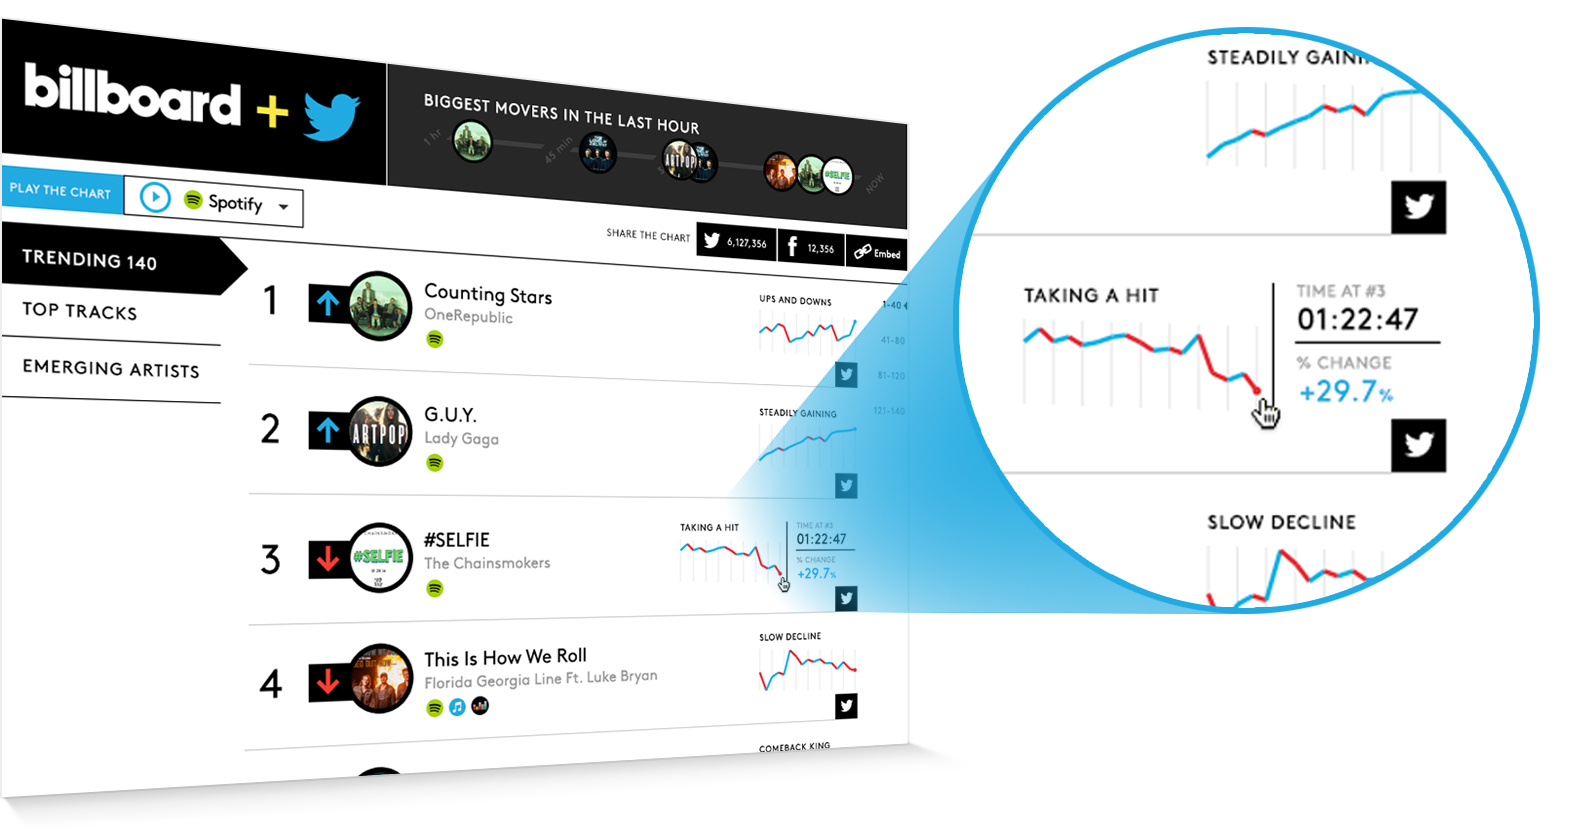
We helped bring the concept to life with the Trending 140—a chart devoted to the rise and fall of music on a real-time basis by how much the track is showing up in conversations on twitter and other social services. For the first time, Billboard was also partnering with streaming services to bring the chart to life as a playlist, all set and ready for your ear holes.
Launching the new charts scored 58% greater site visits and 94% new pageviews.
The charts also allowed for sharing directly from the listing, to help give the audience the chance to boost their positions. The live stock-like chart tracked each song’s progress on the chart over the past 24 hours.
Giving the people what they want
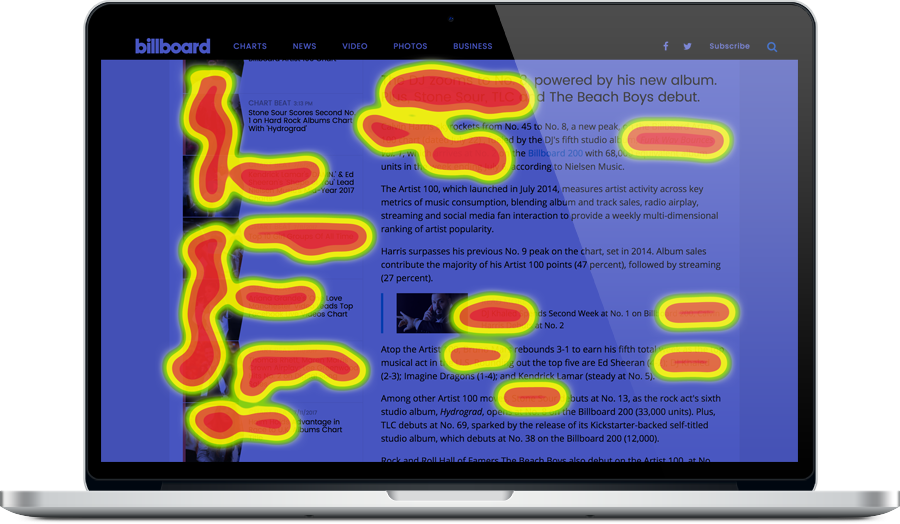
We also redesigned Billboard’s article pages, and found something interesting in their data. People were clicking on artists, but they weren’t links, and didn’t go anywhere. The solution? We create bio template for artists so there was never a dead end.
The chart was a complete success, giving an up-to-the-minute and much-needed interactive twist to the site. The collaboration also led to our next engagement…
Making it Big

We wanted to let users tap into Billboard’s years of data. The On This Day feature is a time machine that lets you know which band you’ve never heard of from the day you were born. It’s linked above. Try it out.
With the Trending 140 alive and thriving, we were called back to redesign the one that started it all: the Top 100.
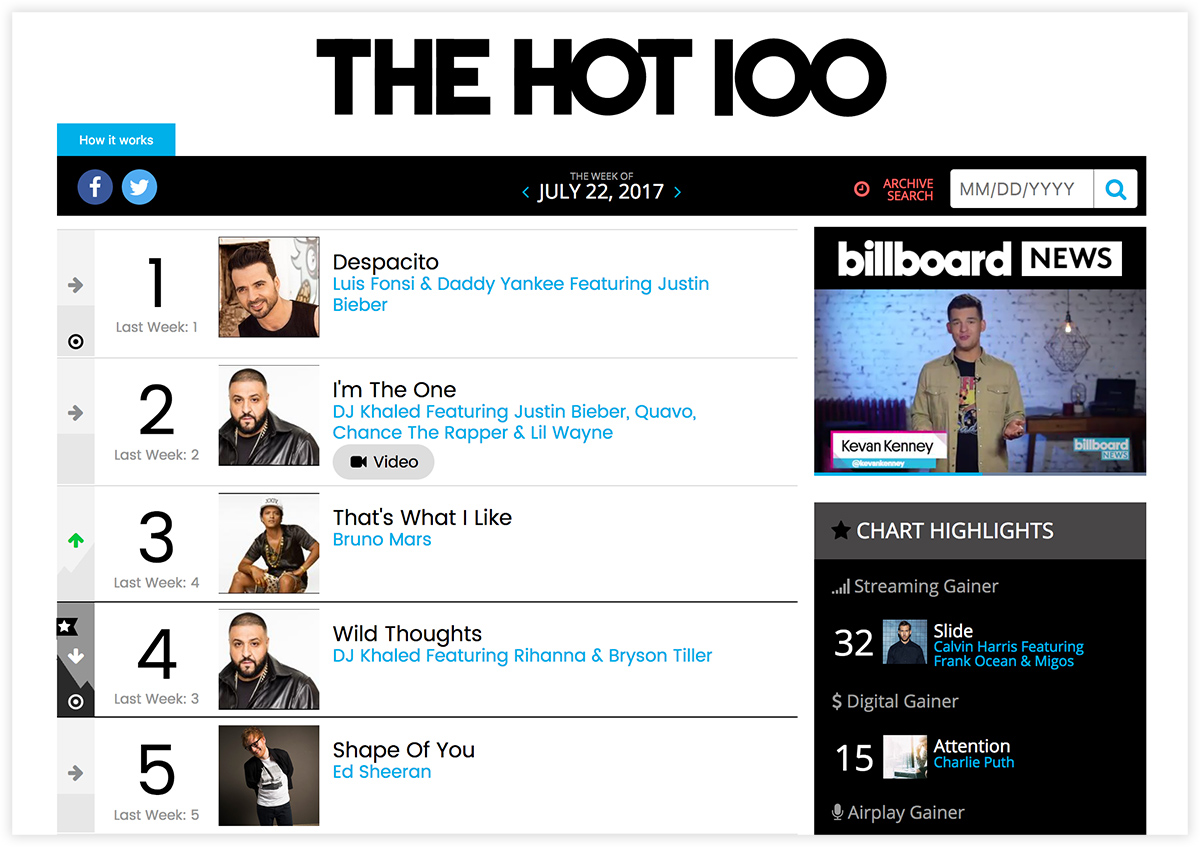
Previously the chart was a reproduction of the version found in the magazine. Big and complicated, it was fine for print and the large base of industry insiders, but digital needed a different take on the information. Something quicker, a little lighter and easier to scan for the mass audience that makes up the majority of their online traffic. We applied a lot of what we learned making the Trending 140 to this chart as well. We hid data behind rollovers and taps to clean up the interface, we gave the overall look a modern polish and added the ability to play tracks on spotify.
But knowing that the actual data is more static (the chart is updated weekly), we also started to play with interactive modules that took advantage of over 50 years of archived chart data. Like, say, the ability to search that archive for the top songs of any particular day. Not to date our creative director, but Donna Summer’s Bad Girls was topping the charts on his birthday. You should look up yours.
The Results
Launching the new charts scored Billboard 58% greater site visits and 94% new pageviews. This success led to Billboard rolling the new chart style through all of its charts. Rock over London, rock on Chicago.